
Neutron Flux Visualization
Understanding the distribution of neutrons inside a reactor core is essential for nuclear engineering tasks. The interaction of these neutrons determine optimal fuel rod placement and geometry. Using MCNP 6.2, we can generate a Monte Carlo simulation of the position of neutrons given various fuel rod designs.
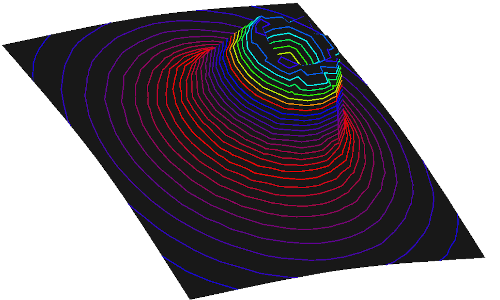
In this example project, we take the point cloud data from MCNP6.2 and generate a scalar field, using Delaunay triangulation to create a geometry. From here, we can use OpenGL to visualize this data. Our visualization technique uses RGB color mapping and height mapping to demonstrate neutron density at various level sets.
You can see the source code here.
Project was completed as a part of the requirements for CS-553 Scientific Visualization @ OSU. Thanks to Massimo Larsen for providing the simulation data.